USDA Report
August 15, 2016 Leave a comment

Greg Mockenhaupt
ProEdge Risk Management Consultant
P: (402) 685-5613 | Greg.Mockenhaupt@cvacoop.com

Greg Mockenhaupt
1007 County Road O
Oakland, NE 68045
Northeast Nebraska's dependable news source
August 15, 2016 Leave a comment
Greg Mockenhaupt
ProEdge Risk Management Consultant
P: (402) 685-5613 | Greg.Mockenhaupt@cvacoop.com
Greg Mockenhaupt
1007 County Road O
Oakland, NE 68045
May 10, 2016 Leave a comment
July Corn +10 ½ @ 3.79 ½
July Beans +51 @ 10.77 ½

Greg Mockenhaupt
ProEdge Risk Management Consultant
P: (402) 685-5613 | Greg.Mockenhaupt@cvacoop.com
1007 County Road O
Oakland, NE 68045
April 14, 2016 Leave a comment
May Corn +3’0 @ 3.59’6
May Beans +1’6 @ 9.30’0
USDA Grain, Oilseed Carryout
| 14/15
Carryout |
March 15/16
Carryout |
Average of Analysts’ Estimates | Range of Analysts’ Estimates | April 15/16 Carryout | |
| Soybeans | 0.191 | 0.460 | 0.456 | 0.415-0.486 | 0.445 |
| Corn | 1.731 | 1.837 | 1.849 | 1.787-1.947 | 1.862 |
| Wheat | 0.752 | 0.966 | 0.978 | 0.959-1.007 | 0.976 |
| Sorghum | 0.018 | 0.065 | NA | NA | 0.065 |
| Cotton | 3.70 | 3.60 | 3.54 | 3.50-3.60 | 3.50 |
| March 14/15 Est | April 14/15 Est | March 15/16 Est | April 15/16 Est | |
| Corn Production | 215.7 | 215.7 | 224.6 | 224.6 |
| Corn Imports | 5.5 | 5.5 | 2.5 | 2.5 |
| Corn Stocks | 100.5 | 100.5 | 111.5 | 109.5 |
| Bean Imports | 78.4 | 78.4 | 82.0 | 83.0 |
| March 14/15 Est | April 14/15 Est | March 15/16 Est | April 15/16 Est | |
| World Coarse Grain Prod | 1298.5 | 1303.4 | 1263.6 | 1261.3 |
| World Coarse Grain Stocks | 241.2 | 243.7 | 243.1 | 245.1 |
| FSU Coarse Grain Prod | 91.5 | 91.6 | 82.3 | 82.5 |
| World Corn Prod | 1009.7 | 1012.8 | 969.9 | 972.1 |
| World Corn Stocks | 205.1 | 207.6 | 207.0 | 208.9 |
| Argentina Corn | 27.0 | 28.7 | 27.0 | 28.0 |
| Brazil Corn | 85.0 | 85.0 | 84.0 | 84.0 |
| FSU-12 Corn | 43.8 | 43.8 | 39.9 | 40.2 |
| Mexico Corn | 25.5 | 25.5 | 23.5 | 24.0 |
| World Wheat Prod | 725.5 | 725.4 | 732.3 | 733.1 |
| World Wheat Stocks | 214.7 | 214.8 | 237.6 | 239.3 |
| European Union Wheat | 156.7 | 156.8 | 158.5 | 160.0 |
| FSU-12 Wheat | 112.8 | 112.7 | 117.5 | 117.6 |
| Australia Wheat | 23.1 | 23.1 | 24.5 | 24.5 |
| Canada Wheat | 29.4 | 29.4 | 27.6 | 27.6 |
| Argentina Wheat | 12.5 | 12.5 | 11.0 | 11.3 |
| India Wheat | 95.9 | 95.9 | 86.5 | 86.5 |
| World Soybean Prod | 318.6 | 319.6 | 320.2 | 320.2 |
| World Soybean Stocks | 77.1 | 77.7 | 78.9 | 79.0 |
| Brazil Soybeans | 96.2 | 97.2 | 100.0 | 100.0 |
| Argentina Soybeans | 61.4 | 61.4 | 58.5 | 59.0 |
Greg Mockenhaupt
ProEdge Risk Management Consultant
P: (402) 685-5613 | Greg.Mockenhaupt@cvacoop.com
1007 County Road O
Oakland, NE 68045
April 4, 2016 Leave a comment
Markets 4/4/16 11:36am:
Dow -8.89
S&P -1.47
Nasdaq -4.77
U.S. Stock markets has been on the way up for six weeks now. This morning drifting lower, holding near their 2016 highs after a recent rally spurred by a weakening dollar and stabilizing oil prices. Major U.S. indexes have rallied for six of the last seven weeks and many investors took comfort in Friday’s solid readings on U.S. manufacturing activity and the March jobs report, which further eased concerns about the strength of the economy.
Oil prices have back tracked reversing all of this year’s gains. We are now back to levels below where we started early January.
May Oil/Crude Futures 
Grain Markets 4/4/16 11:31am:
Corn+0’2@3.54’2
Beans-4’6@9.13’4
As you know last week’s USDA report was released and the special report addressed all USDA data. In summary:

As far as planting goes, Producers in NE Nebraska are patiently waiting to start planting corn. Crop Insurance start date for our area is April 10th. Moisture is more than adequate with 2-3” of total moisture over the last 2 weeks. Temps have been sporadic with daytime highs ranging from 40-75 deg. night time lows range from 24-35 deg. with current 4” ground temp at 47 deg vs. 43 deg same day last yr. Bottom line our soil profile is pretty full and we do have some standing water, ideally we would like a warmer and dryer forecast through April… this week cool mid 50’s and dry.
With regard to acres, there is talk of many producers switching back to beans. At least those that were considering corn on corn. Things have changed and the corn to bean ratio is now back to where we like to see it at 2.5.
Corn: The big weight on Corn is the Planting Intentions, which, even if we do see some switches out of corn and into beans, either due to wetness or better returns for Beans given the rally in the SX/CZ ratio, still means we need a rather sizable crop yield loss to turn this market around, given the current stocks at 1.9 bln bu and the fact that it might take a national yield under 160 bu/acre to drop stocks enough to matter.
Strategy: Call strategies are cheap right now. This will allow you to move the corn now, have a floor, and a shot at upside.
Beans: started overnight a little firmer but have turned into negative territory during the day session, as we saw Soymeal break to losses of $2-3, which is likely due to the fact that the non-Commercial or Spec Fund had covered some of this short, but the cash markets are not following meal values higher, as demand is lethargic and totally hand-to-mouth, as corn’s long term bearish outlook does not bide for meal staying too high in value.
Strategy: 8.00/9.60 Triplex contracts are right in the money. If you don’t have in an offer, this may be an opportunity.


Retirement: Saving for retirement? The rules are about to change. New rules aimed at stockbrokers will have enormous impacts on the way Americans save for retirement.
The rules aren’t coming from the government’s financial regulatory apparatus but from the Labor Department. This week, it is expected to release final regulations that will require brokers getting paid to provide investment guidance on a retirement account to act solely in the best interest of the investor. It will affect IRA’s, and 401K’s as well.
Read more here: http://www.wsj.com/articles/new-government-rule-rewrites-retirement-savings-1459762202
For Fun: Last week this was going around, I received it by email, text, and of course Facebook. But if you haven’t seen it, it is good for a chuckle……or a tear or two.

Greg Mockenhaupt
ProEdge Risk Management Consultant
P: (402) 685-5613 | Greg.Mockenhaupt@cvacoop.com
1007 County Road O
Oakland, NE 68045
February 11, 2016 Leave a comment
Markets 10:25am 2/8/16
Dow -371.49
S&P -43.72
Nasdaq -125.83
Wall Street is having another rough day as the Dow is down more than 300 points in early trading amid a fresh slide in oil prices below the key $30 per barrel mark and continued fears about slowing global growth.
The rocky start to 2016 for stocks looks set to continue as investors contend with well-known yet persistent headwinds ranging from continued price declines in oil, concerns about the impact of China’s slowing growth on the U.S. and other world economies, and questions surrounding the timing of interest rate hikes from the U.S. Federal Reserve. A Sunday meeting between Saudi Arabia and Venezuela ended without any plans for production cuts, damaging hopes that the world’s major exporters will cooperate on output cuts.
In the ethanol, we have RBOB gasoline trading -45 cents cheaper than ethanol futures, which is not promising for ethanol.

Grain Markets 10:28am 2/8/16
Mar Corn -1’4 @ 3.64’2
Mar Beans -3’0 @ 8.64’4
USDA Report on Tuesday 2/9/16 at 11:00am
Funds: An interesting topic is the funds short position. I mentioned 1/11 the funds were record short, and I also mentioned my concerns on 1/18 seen below:
“shorts will have to cover at some point and we may have a shot at a bear market rally. Manage your risk and be prepared for the unknown. Spec funds have added 150,000 new shorts since Dec 16th. With everyone suggesting we “Sell the rally’s” the farmer is likely to hold pricing down as they sell these bounces. With farmers long the physical, and funds short the board a chance at a significant rally will be difficult without a major story. I am not saying we cannot have a rally in a bear market, just that it will probably be short lived as farmers look for opportunities to move grain. This makes short covering an easy proposition for the funds, versus making the funds over pay and driving up price.”
On Jan 26th the net fund position on corn dropped from -160,153 to -91,929. The short position continued to decrease until just a couple of days ago. Currently estimated at -84,788 as of Friday. Looking at the charts below the orange line represents manage money/funds. Note that historically the funds are still very short. This represents an opportunity in the event of a scare causing a rapid short covering. Notice in the charts below, when funds cover, they historically do it in a big way. Keeping in mind my comments from 1/18, a slow short covering may not be as supportive to the grain market.


Recommendations: After the USDA report, ProEdge will be releasing official client recommendations. Expect to see this information late next week via email.
Weather:
It looks to remain cold through President’s Day then trending warmers in the 11 to 15 day.

For Fun:
The Denver Bronco were victorious defeating the Carolina Panthers 24 to 10 in the 50th Super Bowl. Highlight video seen here:https://youtu.be/DR0qOk_pcyg
Greg Mockenhaupt
ProEdge Risk Management Consultant
P: (402) 685-5613 | Greg.Mockenhaupt@cvacoop.com
1007 County Road O
Oakland, NE 68045
February 11, 2016 Leave a comment
US Carry Out and World Ending stocks come in slightly higher in both Corn and Beans. This was expected by the trade and seen as neutral, causing no real movement in the market.

Greg Mockenhaupt
ProEdge Risk Management Consultant
P: (402) 685-5613 | Greg.Mockenhaupt@cvacoop.com
1007 County Road O
Oakland, NE 68045
January 12, 2016 Leave a comment
Prices are higher. USDA lowered US 2015 corn and soybean crop. USDA also dropped US 2015/16
soybean carryout
SH is up 14 cents and near 8.75
CH is up 5 cents and near 3.57
WH is up 6 cents and near 4.76
2015 US crop production (Million Bushels, Except Cotton in Thousand Bales)
2014 2015 Ave Trade Trade
Crop Final USDA USDA Estimate Range
Corn 14,216 13,654 13,601 13,646 13,525 – 13,770
Soybeans 3,927 3,981 3,930 3,981 3,926 – 4,043
All Cotton 16,319 13,031 12,940 NA NA – NA
2016 US winter wheat seedings (Thousand Acres)
Ave Trade Trade
Class 2015 USDA Estimate Range
HRW 28,978 26.50 28,810 27,576 – 29,592
SRW 7,087 6.70 7,144 6,400 – 8,539
White 3,396 3.40 3,366 3,250 – 3,500
All Winter 39,461 36.60 39,320 38,250 – 40,796
Dec. 1, 2015 grain and soybean stocks (Million Bushels)
Ave Trade Trade
Crop Dec. 1, 2014 USDA Estimate Range
Corn 11,211 11,216 11,237 11,073 – 11,440
Soybeans 2,528 2,715 2,720 2,590 – 2,850
Wheat 1,530 1,738 1,698 1,670 – 1,732
US 2015/16 ending stocks (Million Bushels, Except Cotton in Million Bales)
USDA USDA Ave Trade Trade
Crop December January Estimate Range
Corn 1,785 1,802 1,785 1,642 – 1,860
Soybeans 465 440 468 430 – 492
Wheat 911 941 919 891 – 941
Cotton 3.00 3.10 NA NA – NA
Greg Mockenhaupt
ProEdge Risk Management Consultant
P: (402) 685-5613 | Greg.Mockenhaupt@cvacoop.com
1007 County Road O
Oakland, NE 68045
January 12, 2016 Leave a comment
Markets 1/11/16 11:57am
Dow -13.28
S&P -7.73
Nasdaq -33.54
Oil dropping aggressively this am. Oil prices dropped another 10% last week, sitting at 12 year lows. Current low 31.55, looks as if oil in the 20’s is reachable. Especially since oil companies have been producing about 1 million barrels per day more than is used. Total US inventory is 25% more than last year this time. Laws of supply and demand rule, and with a glut of oil like this, crude will be hard pressed to do much of anything but move down, and reduce profitability for ethanol and crush processors. I wonder if government “bail outs” are in the future for U.S oil companies.
Grain Markets 1/11/16 11:58am
March Corn -7’2 @ 3.49’6
March Beans-5’0 @ 8.60’2
USDA report around the corner, much of what I tell you will soon be tested as of tomorrow. I will add funds are very short, so a friendly surprise could cause short covering. At some point funds will have to cover, hopefully this gives us a selling opportunity.
USDA announced some sales this morning – 120 T of beans to China and 248 T sold to unknown in 15/16 and; 152 T of corn sold to unknown in 15/16. This helped the beans rally after the morning break but they are currently struggling.
Corn – The fact that $3.50 has held on nearby corn is a good thing. Though it broke, it never held. We are making a run at $3.50 again this am, and the continued pressure makes it appear less and less likely to hold. Oil prices continue to pressure ethanol producer margins, exports are behind pace. As the market trickles down, basis values firm up. Giving producers an opportunity to get some basis levels set on old crop hedges, or basis contracts for future deliveries.
Beans – Exports behind pace and the USDA is likely to adjust. Current record yield could be pushed higher thus increasing ending stocks. Economic uncertainty in China certainly doesn’t help the export picture, nor does the strong US Dollar. In general the trade expects a bearish report, so the questions is, is the news already built in?


Greg Mockenhaupt
ProEdge Risk Management Consultant
P: (402) 685-5613 | Greg.Mockenhaupt@cvacoop.com
1007 County Road O
Oakland, NE 68045
July 13, 2015 Leave a comment
![]()
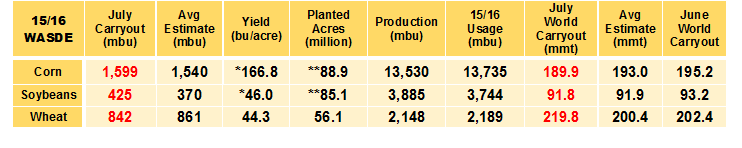
*Yield was left unchanged, but will be updated in the August S&D report
**Acres were pulled from the June 30th Planted Acreage report
CORN
The friendly June 30th Stocks report allowed the USDA to raise old crop feed demand 50 mbu this month. Combined with increases in ethanol (+25 mbu) and exports (+25 mbu), improved demand shrunk the 14/15 carryout by 97 mbu. The new crop balance sheet saw the USDA leave yield estimates unchanged, noting that updates would be available in their August 12th report. Acreage numbers were pulled from the June 30th acreage report, so the reduction in harvested acres allowed production estimates to decline 100 mbu for new crop corn. New crop demand projections saw feed (-25 mbu) and exports (-25 mbu) reduced, while ethanol added 25 mbu. The net effect was a reduction to the new crop carryout of 172 mbu – the market was looking for a little bit more. Our Take: The market is trading its own yield ideas right now, so the USDA leaving their number unchanged had little impact to the trade. It will be difficult to get an accurate feel on the national yield until we see the USDA’s thoughts on August 12th. Until then, crop ratings and the weather forecast through pollination will dictate whether we go higher or lower. The funds are supporting the market right now, which continues to push corn higher.
SOYBEANS
The old crop soybean balance sheet saw demand continue to work higher with crush and exports each adding 15 mbu on Friday. The June 30th stocks report confirmed a tighter soybean situation that some suspected, which resulted in a 44 mbu increase to residual demand. This essentially means that the USDA overestimated the size of last year’s crop and they are accounting for it here. The result was a 75 mbu reduction to the old crop carryout. New crop saw acreage ideas come straight across from the acreage report in June, while yield was left untouched and will await August revisions. The higher acres from June bumped production higher (+35 mbu), but a smaller carry-in and an increase to crush demand (+10 mbu) led to a net reduction in the carryout by 50 mbu. However, at 425 mbu, the estimate was higher than pre-report thoughts. Our Take: The soybean market has acreage and yield questions right now, even after the updated acreage numbers in June. Until the USDA updates their thoughts on both of these categories, the market should stay supported. There seem to be too many question marks with soybeans right now to push them aggressively lower.
At the close of trading today:
CORN: +6’0 $4.34’4
SOYBEANS: +4’0 $10.30’2
WHEAT: -8’0 $5.71’2
Greg Mockenhaupt
ProEdge Risk Management Consultant
P: (402) 685-5613 | C: (402) 380-9855 | Greg.Mockenhaupt@cvacoop.com
1007 County Road O
Oakland, NE 68045
March 31, 2015 Leave a comment
USDA Report released today at 11am and the reaction was quite the show.
Beans
Beans traveled from -12 back to +12 in less than 5 seconds. The amount of volatility was neat to see. The day started with beans down anticipating an acreage increase. Turned out the opposite sending beans up to 9.81. Bean stocks up 34% from March last year, beans acres up but still a new high.
Corn
Corn started this morning in the green anticipating unchanged acreage or a slight reduction in acres, but the report showed an increase in corn acres sending corn all the way down to a low of $3.79 ½. Corn stocks up 11% from March last year/corn acres higher than expected.
USDA Numbers
USDA Avg Est Last Year
Corn 89.199 88.731 90.597
Soybeans 84.615 85.919 83.701
Greg Mockenhaupt
ProEdge Risk Management Consultant
P: (402) 685-5613 | C: (402) 380-9855 | Greg.Mockenhaupt@cvacoop.com
1007 County Road O
Oakland, NE 68045


Recent Comments